Thursday 9 January 2014

Murderous Maths at Sidney Stringer Academy


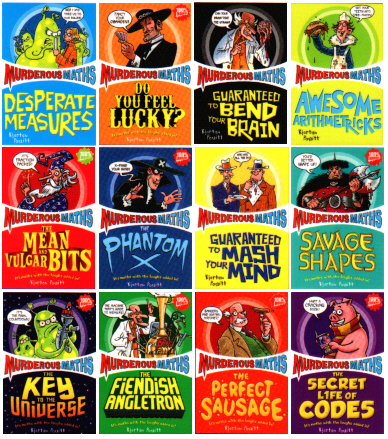
Today we were lucky enough to have Kjartan Poskitt, author of the Murderous Maths books, come to the school to wow the year sevens and eights with mind-boggling mathematics.


Kjartan performed magic tricks, showed us some arithmetic tricks, tried to steal a fiver of someone, dazzled us with large numbers, calculated huge sums faster than a calculator, and much, much more.


The students loved it and their reactions alternated between laughing their heads off, jumping up and down in their seats begging to be picked as a volunteer, and sitting in wide-eyed amazement as Kjartan blew their minds with mathematical facts.


If you would like Kjartan to perform at your school, click here to visit his website.

Wednesday 18 December 2013

3D Fractal Christmas Tree


A Menger Sponge, a Sierpinski Tetrahedron, and a Koch Snowflake. Put together by 11.1 to make:


A 3-D fractal Christmas tree!

Make yours by following these instructions.

Merry Christmas from Sidney Stringer Academy Maths Department!

Thursday 17 October 2013

Teaching Ratio to Low Attaining Students

Last week was internal observation week at Sidney Stringer Academy. After the stress last year of a looming Ofsted inspection (which we passed with flying colours), this term's observations were met with a lot less panic. The maths department certainly seemed more laid back than usual.
 
For mine, I was being observed with my year ten class. This class is aiming for grades G, F or E at GCSE. Most of them have a Roma background, and they all have their own barriers to learning to overcome. I have taught this class for over two years now, so we know each other pretty well.
 
The topic I was due to teach was ratio. I had a double lesson, and spent the first hour introducing the idea of ratio. In the second hour, of which the first thirty minutes were observed, I taught them how to share a quantity in a ratio.
 
My observers graded the lesson as "outstanding", so I thought other people might be interested to know exactly how I taught it.
 
My class had recently been working on times table facts, factors, and multiples. I knew that these areas were fairly strong for them. I also knew that the concept of proportionality, including fractions and scale factors, was a weak area for them.
 
I gathered the class around one big table in the middle of the room. I like doing this because it feels a bit primary school-y. There are only 14 students in the class so this wasn't too squashed. The students did not bring their books with them, there was no need for them to take notes.
 
I handed out a whiteboard and pen to three specifically chosen students. They were chosen because they were unlikely to contribute to the discussion, either because they were too shy, or likely to be disengaged.
 
I told the class I wanted to share a bag of 24 sweets (counters) between the oldest and youngest member of the class. These two girls were conveniently sitting on opposite sides. I explained that I didn't want to share them equally, because I thought the older girl deserved more than the younger girl. They seemed to be happy with this idea. I said I wanted to share them in the ratio of 3:5. They had seen this notation in the previous hour (remember, this was the second half of a double) and knew vaguely what this meant.
 
The three whiteboard holders had the job of recording what was going on. One student was to record the number of counters that the youngest had, one recorded the oldest's number, and the third recorded the total number of counters that had been given out.
 
I started to give out the counters. I gave 5 to the eldest, and 3 to the youngest. The recorders dutifully wrote 5, 3 and 8. Then I gave out another lot of 5 and 3. The numbers were changed to 10, 6 and 16. Then I gave out another lot and we had 15, 9 and 24. I asked the students to comment on any patterns they had noticed. Many of them spotted the 5 times table and the 3 times table, and amazingly they even noticed the 8 times table. I took a mini whiteboard and drew a little table to show the numbers at each stage. This was me modelling how to lay out their working out when it came to doing it themselves.
 
Next I told those with the boards to pass them to someone else, and I took back the counters and added some more to the pile. I picked another two students to share between. I picked a new ratio, and again said the older of the two should get more (please tell me I'm not the only teacher who has memorised their students' birthdays! Not on purpose, I hasten to add). I did the same thing again, and students were telling me the numbers before I even managed to give the counters out. That showed me that the students had managed to move away from the concrete towards the abstract already. Again, I modelled how to write down the solution. Then I said to them, "Are you ready to do this by yourselves?" and they all responded yes. Then they all went back to their seats and did just that. They tackled the questions wonderfully. They were all happy to have a go.
 
Here are the worksheet used and some examples of the students' work:


This student was very confident with the method.
The sentence at the bottom of the page demonstrates that this student knew what they were doing.


This student did the times tables up as far as they thought they needed, and ended up with too many to add to make 50. This doesn't matter though, they can cross out the ones they don't need. "Mistakes" aren't punished in my class.
 
In my feedback, I was told that this lesson was effective because:
  • It was very simple
  • Every student was engaged
  • Every student was motivated and eager to learn
  • The lesson was pitched at the right level
  • The method built on the students' prior knowledge.
I know this is not the traditional method for sharing in a ratio. It is long winded and a bit ridiculous when it comes to numbers over 100. But I knew my students would understand it. The normal method is to see 3:5 as 8 "parts" and to divide the quantity by the number of parts to work out how much is in each part, then multiply by 3 and 5. Can you see that this method is a lot more abstract, as it talks about "parts"? Although this can be faster, I feel that it is more confusing, and hence difficult, unless you understand the rationale behind it. For a group whose average KS3 level was a 2a, my method was a lot more appropriate.
 
I hope this lesson "plan" can be of some use to you. My actual formal lesson plan is available on request: email me at ecooke.staff (at) Sidneystringeracademy (dot) org (dot) uk. (I'm writing this weirdly to avoid spam robots).


Friday 11 October 2013

Some Mathematical Literacy

My students know that I love to talk about language in my maths lessons. I appear to be particularly obsessed with Latin and Greek. It seems I can't introduce a new mathematical term without exposing its etymology. I think it's a great skill for students to learn though: to be able to use known prefixes and roots to work out the meaning of an unknown word.
 
I put together this PowerPoint to test students on:
  • Funny plurals in mathematical words (e.g. formulae, vertices)
  • The number prefixes like tri-, oct-, etc
  • Guessing the meaning of foreign words for numbers.
 
My mathematical literacy PowerPoint can be found on the TES.
 
I have used this with middle-ability year nines.
 
Let me know what you think!
 

This post was written by Emma Cooke, Sidney Stringer Academy, Coventry

Monday 7 October 2013

Mathematical Thunk: Averages

I love whole-school teaching and learning meetings. Although maths lessons are completely different from, say, history lessons, you can pick up so many new ideas from non-maths teachers.

We are lucky at SSA to have several Teaching and Learning Consultants - one in each faculty, plus a few Advanced T&L Consultants who support all departments. These are teachers who have some of their timetable allocated to supporting other teachers.

One such Advanced T&L Consultant is Zayn Bharuchi, a psychology super-teacher. She inspired me to feature mathematical "thunks" regularly on this blog. The first thunk comes directly from her, and when I read it, I was completely blown away by how imaginative it is.

Mean, Mode and Median brothers. But they want some Hollywood glamour and a more than average surname. Thunk: What is their surname?

Isn't this brilliant? I like to think I'm a creative maths teacher, but I never would have come up with this in a million years! That's because my creativity is often limited to mathematical ideas (and jewellery).

And as an extension, another nice question:

Who is the eldest/youngest sibling? Why?

This got a nice debate going in the maths office. I am definitely going to use these questions next time I teach averages.  Thank you Zayn!

This post was written by Emma Cooke, Sidney Stringer Academy, Coventry


Tuesday 1 October 2013

Concrete-Abstract-Concrete

There's one word you here quite a lot when my department gets together to discuss teaching and learning: "Concrete".

Pupils need to be given something in a concrete form before moving to the abstract. Then, when misunderstandings come about, you can move back to the concrete until the pupil gets it enough to move back to abstract.

Take, for instance, pie charts. I remember teaching this two years ago and being observed as my NQT observation for that term. Ofsted also happened to be there. Fun times. I was teaching middle-set year 7s how to find angles for pie charts. I taught it in this way:
There are 60 people, and 30 of them travel by bus. So what angle will they be?
Half of the pie, which is 180.
Good, so if 15 travel by car, what angle will that be?
Quarter of the pie, which is 90.
So if 22 people travel by bike, what angle will that be?
Well the fraction is 22 out of 60.
Good, so we want 22 60ths of 360 degrees.

I thought this was quite a natural way of doing it, because pupils can tell straight away the angles for easy fractions like halves, and quarters. I thought extending it to harder fractions would still make sense to them (and the previous chapter was fractions, so they know how to find 22 60ths of a number).

However in my feedback, my boss colleague explained that this method goes abstract too quickly. It isn't concrete, it relies too much on ideas and concepts rather than things that are picturable and practical. (Please excuse my poor literacy. But in my opinion picturable definitely is a word).

The method that was suggested to me was this:
How many people are in the survey?
60.
How many degrees are in a circle?
360.
So if 60 people were all trying to fit around the edge of a circle (mental picture), how many degrees would they get each?
6.
Good, so if 30 people travel by bus, how many degrees would those people take up?
6 x 30 which is..... 180.

I think this method is less natural, more forced. But I can see that it is more concrete than the other method. You can picture the people jostling each other around the circumference, having to squeeze into their 6 degrees. You could even get the students to stand in a circle and make a human pie chart. You can then change this into a formula is you like (the abstract) but then if a student struggles to remember the formula you can then go back to the concrete, because they will always have that as a back-up.

For me, the fraction thing is more intuitive, but I have to remember that I have a maths degree and hence am clearly not normal. My mind works differently from other people's. Maybe the leap from halves and quarters to 22/60 is too much of an abstraction for students, especially year sevens working at level 4.

Which method do you use when teaching pie charts? Have you found one method to be more effective/memorable than the other?

This post was written by Emma Cooke, Sidney Stringer Academy, Coventry

We Need to Talk about Resits

*The views expressed in this post are my own and do not necessarily reflect those of Sidney Stringer Academy*

I'm sure you've heard the news: Mr Gove (bless 'im) has decided that resits will no longer count in league tables. For many schools, including Sidney Stringer Academy, this very well thought-out (pah!) policy will mean reconsidering their strategy with regards to when students will sit their maths exam.

As you may know, Sidney Stringer Academy is currently in the top 1% of schools nationally for progress in maths. We're not ashamed to admit that our students resit their maths GCSE. They all take it at the end of year 10, and then in year 11 they have a personalised timetable based on their maths and English grades. Some students will work towards a resit in November, some June, and some will take GCSE Statistics or Further Maths if they have already achieved a good grade. Some students have two hours a week of maths, some four, some even more. This personalised timetable is only available to our students because they take their maths and English GCSEs in year 10.

We could keep our strategy exactly the same. The students will continue to get great grades. However, our position in the league table would probably drop. Now there's a moral dilemma!

The other option of course, is to have all students take maths at the end of year eleven. Here are the disadvantages of this:
- Some students' attendance starts to get worse and worse during year eleven.
- Some students' behaviour, motivation, and engagement gets worse too.
- Our talented students may not get to study Further Maths GCSE, so our A level results may suffer.
- If Ramadan falls during the summer exam season (which it will soon), Muslim students (a huge percentage of the SSA population) may be disadvantaged due to dehydration, hunger, and disrupted sleep.
- The number of year 12 students resitting maths alongside doing BTECs or A levels could be huge. This may adversely affect students' BTEC/A level results.

I suppose what we have to do is look at individual groups of students and consider what's best for them.

What's your opinion on this new policy? How will you adapt your strategy?


This post was written by Emma Cooke, Sidney Stringer Academy, Coventry